 |
| What is a Glyph? |
Remember coloring pages where you had to color in each of the numbers or letters using a key to color certain areas? Or how about coloring books that were filled with color-by-numbers? These color-by-number pages are a type of glyph. Some other activities we can call glyphs would be the paint-by-number kits, the water paints by color coded paint books, and in some cases, even model cars. Some of the model cars had numbers or letters attached to each piece that had to be glued together. These days, this could be considered a type of glyph.
What is the Purpose of a Glyph?
A glyph is a symbol that conveys information nonverbally. Glyphs may be used in many ways to get to know more about students and are extremely useful for students who do not possess the skill to write long, complex explanations. Reading a glyph and interpreting the information represented is a skill that requires deeper thinking. Students must be able to analyze the information presented in visual form. In other words, a glyph is a way to collect, display and analyze data. They are very appropriate to use in the CCSS data management strand (see standards below) of math. Glyphs actually a type of graph as well as a getting-to- know-you type of activity.
CCSS.Math.Content.1.MD.C.4 Organize, represent, and interpret data with up to three categories; ask and answer questions about the total number of data points, how many in each category, and how many more or less are in one category than in another.
CCSS.Math.Content.2.MD.D.10 Draw a picture graph and a bar graph (with single-unit scale) to represent a data set with up to four categories. Solve simple put-together, take-apart, and compare problems using information presented in a bar graph.
For example, if the number of buttons on a gingerbread man tells how many people are in a family, the student might be asked to “Count how many people are in your family. Draw that many buttons on the gingerbread man." Since each child is different, the glyphs won't all look the same which causes the students to really look at the data contained in them and decide what the glyphs are showing.
 |
| $3.00 |
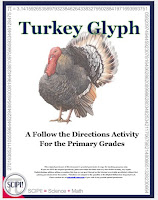
1) Draw a hat on the turkey (girl or a boy?)
2) Creating a color pattern for pets or no pets.
3) Coloring the wings based on whether or not they wear glasses.
4) Writing a Thanksgiving greeting based on how many live in their house.
5) Do you like reading or watching TV the best?
6) How do they get to school. (ride or walk?)
7) Pumpkins (number of letters in first name)


No comments:
Post a Comment